
I interact with Amazon sellers every single day. Without a doubt, the one topic that comes up over and over again is Amazon’s Best Seller Rank (BSR). In my years of helping Amazon sellers, I’ve answered the same 7 questions hundreds of times.
This guide will answer all of these questions and more. After the basics, we’ll cover more advanced topics, including how to read an Amazon sales rank chart, how to optimize your BSR and how to pick great products using hard data.
Before we jump into the fray, let’s go over the basics. If you already know what a best seller rank is and the generalities of how it works, just hit the button below to jump to the nitty-gritty part of the guide.
Take me to the advanced section
What is an Amazon bestseller rank?
Every product on Amazon has a numerical rank associated with it. The rank holds no intrinsic value but is simply a measurement of the period of time since an item last sold. The more units of an item are sold, is the closer it’s rank will be to #1. A higher sales rank means a product sells less often than other items within its category.
When you look at sales rank make sure to look to use a software program that gives you the average rank over time. A rank may have a major spike or dip in the short term, so it’s never a good idea to base a financial decision on a small sliver of data.

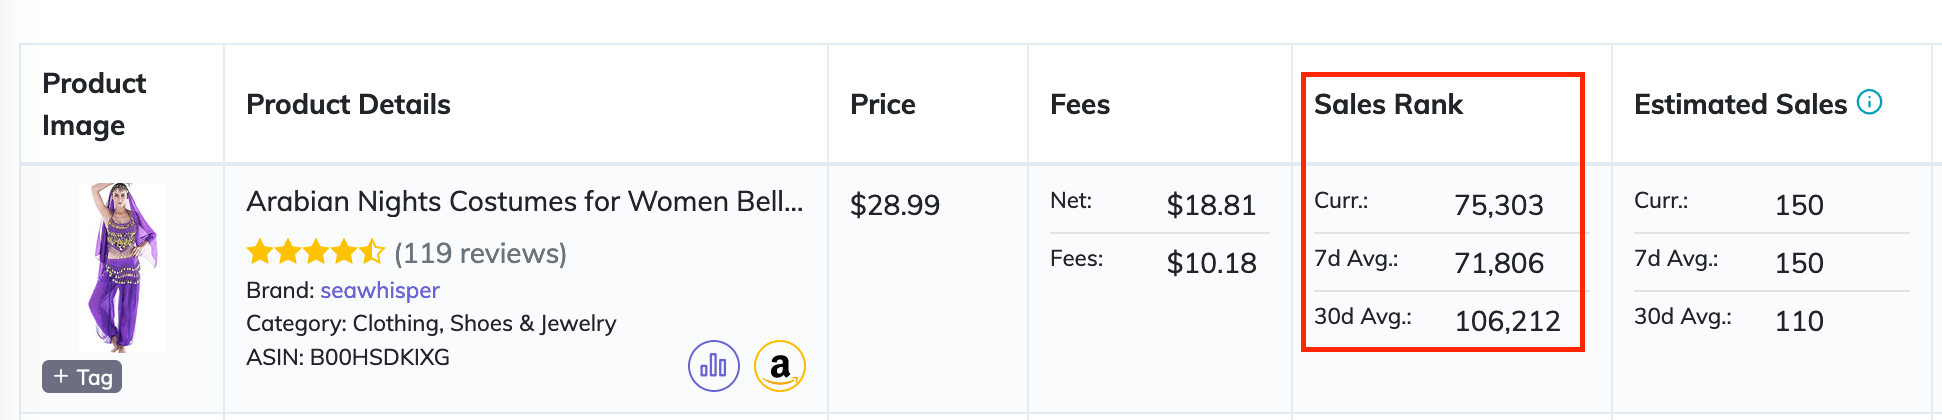
ProfitGuru provides both a 7-day and 30-day average sales rank on Amazon products to help sellers make data-driven purchasing decisions.
Where can I find a BSR?
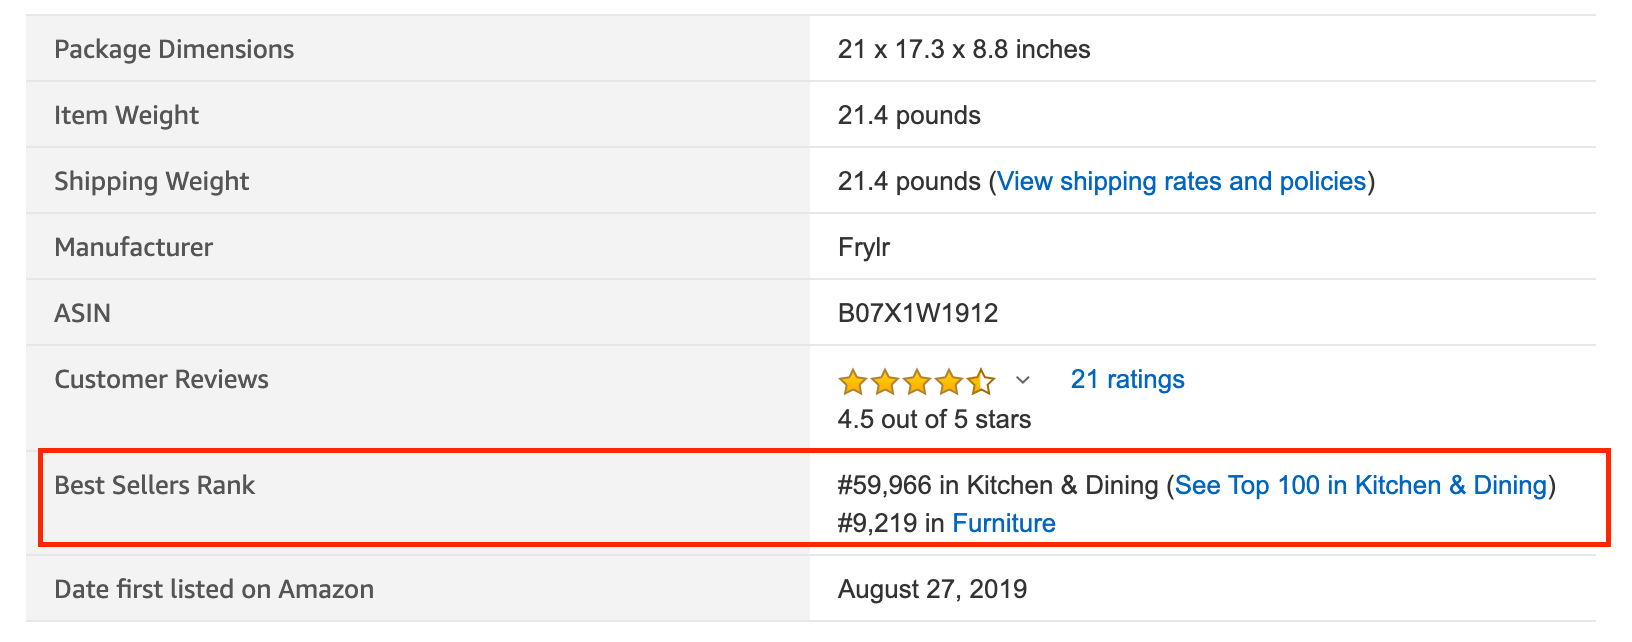
You can find a sales rank on the seller app or at the bottom of any Amazon.com detail page under product details.
What does an Amazon sales rank actually mean?
BSR can help you understand the sales velocity of an item and how it lines up with other products in its category.
For example, this toothbrush set is currently the #11,706 ranked product within the Health and Personal Care category. On its own, this info may not seem to mean much, but the ProfitGuru Sales Estimator uses an aggregate of this data to estimate how many times the product sells each month.
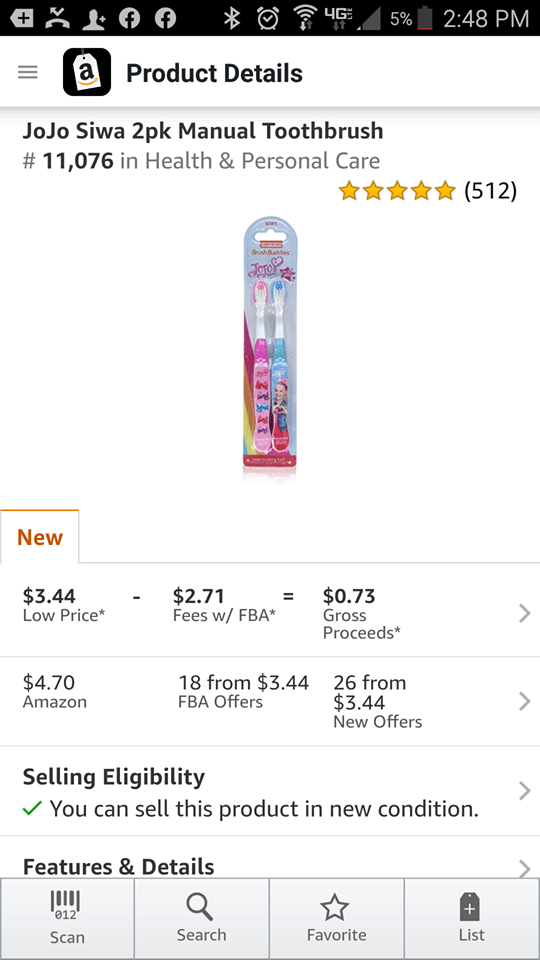
You can also estimate on your own using an Amazon Sales Rank Chart, which I’ll review below.
Here’s something every Amazon seller should remember: theoretically, right after an item is sold its rank will dip closer to 0. The rank will rise until it sells again.
The reason I say theoretically is that Amazon only updates sales rank every 2-3 hours -- so any “dips” you see are aggregates of sales that happen throughout the day.
Here’s a graphic visualization of some of these dips using ProfitGuru’s Amazon rank charts. We’ll delve deeper into these charts in the second half of the guide.
![]()
This is a 30-day chart of a slow-moving item in the books category. The rank dips every time there is a sale, but rises between each sale.
What is a good Amazon sales rank?
This is where it gets a little complicated. You see, sales sank is category dependent. There are a certain number of products within each category, but categories are vastly different in size. A toy with an average ranking of 5000 sells a much different volume than a video game with the same rank.
Here’s a complete list of Amazon’s main categories:
- Appliances
- Art, Crafts, & Sewing
- Automotive
- Baby Products
- Beauty & Personal Care
- Books
- CD's & Vinyl
- Cell Phones & Accessories
- Clothing, Shoes, & Jewelry
- Everything Else
- Grocery & Gourmet Food
- Handmade Products
- Health & Household
- Home & Kitchen
- Industrial & Scientific
- Movies & TV
- Musical Instruments
- Office Products
- Patio, Lawn, & Garden
- Pet Supplies
- Software
- Sports & Outdoors
- Tools & Home Improvement
- Toys & Games
- Video Games
The rule of thumb is to sell products that rank in the top 5% of any category (or 1% if your business model is based on a higher volume).
The total number of items in a category * .05 = Top 5%
To calculate this, download our free Amazon Best Seller Rank chart here.
Each of the above categories will also have sub-categories. Most subcategories don’t have a rank, but occasionally they will show up in the app (especially electronic items). Be careful not to get tripped up on this -- if an item is truly low-ranking it will always be accompanied by reviews and ratings.
Take the example below. #220 looks like a fabulous ranking in electronics, but there are no reviews or current sellers. On closer inspection, this item is ranked #220 in the sub-category Blank Floppy Diskettes -- not nearly the same, considering the entire sub-category has less than 300 ASINS.
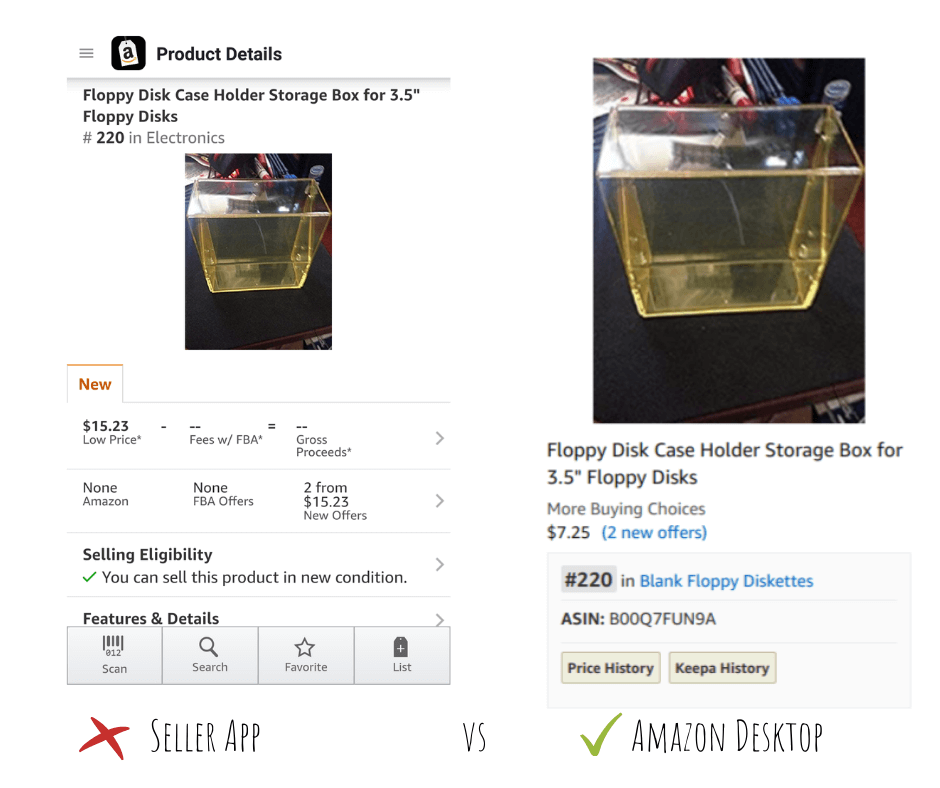
Rank should correlate very roughly with reviews. If a product has thousands of reviews, the rank is more than likely accurate. When in doubt, you can always double-check on the actual Amazon website.
![]()
Why is BSR important?
BSR is an indicator of how often your product sells but doesn’t directly produce sales or alter the buying decisions of customers. It’s an important metric but not something you want to set goals around.
In short, a lower BSR is the end result of having more sales.
This being said, BSR does help you to understand how quickly you can expect to turn your money. If the product you want to sell already exists on Amazon, a sales rank gives you an immediate idea of product volume. Similarly, if you are launching a private label product you can use the BSRs of similar products to calculate the sales potential of your investment.
If you want to improve BSR, consider tracking/ adjusting some of these metrics:
- Organic keyword ranking
- Amazon product reviews/ranking
- Buy box ownership (for wholesale products)
- Conversion rate
- Number of daily sessions
Where can I find Amazon sales rank history for free?
There are a number of good services available to look at BSR history. While most of them have been free in the past, a majority have recently become paid services.
Luckily, ProfitGuru still provides free sales rank charts for most Amazon products.
Why doesn’t my product have a rank?
If you find a product without a rank or sales history, it typically means that the item has never sold (or hasn’t sold in a long time). These items may be slow-moving or sold rarely because no seller is consistently in stock.
There’s also a chance the rank may have vanished because of a back-end glitch. You can typically tell this is the case if there is a product with many recent reviews but no rank. A ranking will eventually appear as long as the product is actively being sold.
Why did my product rank disappear?
There are a few reasons a product rank may vanish.
- It may be temporary. The BSR on any Amazon listing can disappear temporarily because of system latency or a misdirected path on the back end of the listing. If this is the case, wait 24 hours and see if the rank has reappeared. If nothing happens (but you’re still getting sales and the detail page is visible) contact Amazon Seller Support and ask them to check on your listing paths.
- Amazon changed the category. For whatever reason, Amazon will occasionally move a product from one category to another, resetting the sales rank. Theoretically, this shouldn’t have an impact on sales numbers, but many Amazon sellers have reported otherwise.
If the product is clearly in the wrong category (a video game in health and beauty, for example) contact Amazon Seller Support and ask them to fix the categorization. This typically requires battling through a lot of red tape; Amazon may ask for documentation to prove you own the problem product.
If the product is in the correct category but still has no rank, consider bumping up your PPC to see if an uptick in sales will make it reappear. Unfortunately, most of the time a lost best seller rank is a waiting game -- it always comes around, but sometimes it can take a few days.
Questions from seasoned sellers
Now that we’ve covered the basics, here are a few questions I’ve recently answered from those who are already selling on Amazon, but want to streamline their product sourcing process. For the purpose of this article, I used product charts from ProfitGuru. Other software platforms provide the same info but it may vary in layout.
How do I read an Amazon rank chart?
A good Amazon rank chart should provide you:
- Sales rank (obviously)
- Pricing information
- Number of sellers
- A minimum of a year of data (assuming the product has existed this long)
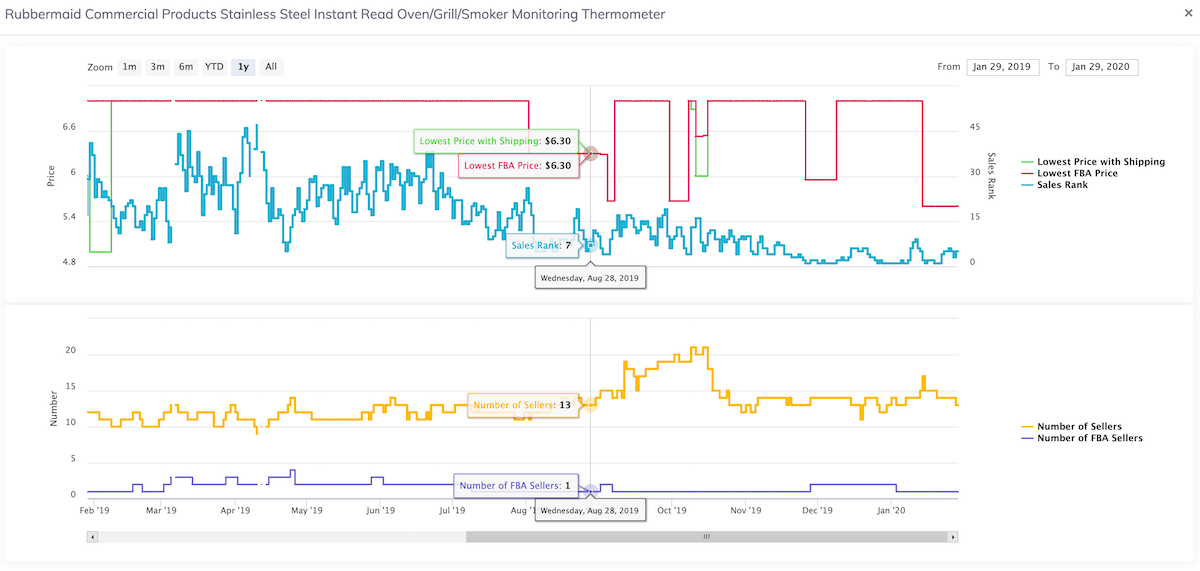
ProfitGuru splits this data into two charts -- price/rank and number of sellers. It’s a little easier on the eyes than having all the data together.
Let’s break it down piece by piece.
The first line is pink and tracks the lowest FBA price. In this Rubbermaid example, the price has been fairly steady only seriously dipping about 15 days of the year. This tells me the product has a fairly stable set of sellers who are likely wholesalers.
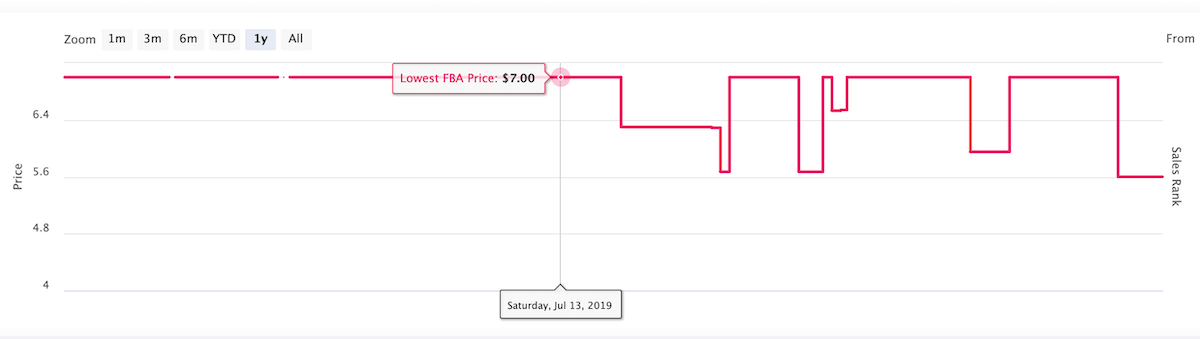
Just to contrast, look at this graph for Scotch Heavy Duty Shipping Packaging Tape. This listing has a lot more sellers (many of whom are probably sourcing via retail arbitrage) so there is much more price fluctuation from day-to-day.
Next, let’s add in the green line: lowest overall price. This includes sellers who Merchant Fulfill products. Typically these sellers have little impact on FBA sales, but it’s always good to make sure they’re not undercutting so much that it makes a difference.
![]()
Most of the green line isn’t visible, which means the MF price is basically the same as the FBA. There are two notable dips but they only cover a few days of the year.
The last line of this chart is the sales rank. Right off the bat, you can see how much it fluctuates, meaning it’s an item that sells very well.
Let’s look a little closer and see if we can spot any anomalies.
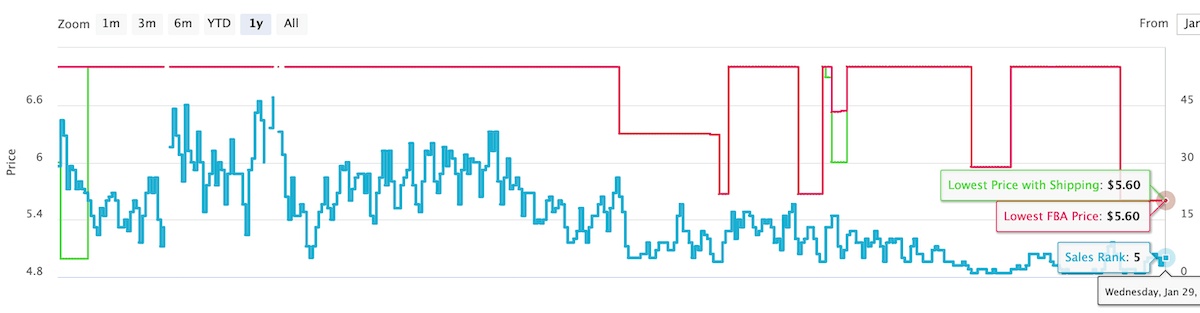
See the tiny gap in data in both the price and sales rank lines? This likely means the product was completely out of stock. While this doesn’t matter much for this particular chart (it was likely out of stock for a day or less) some sellers like to look at how often/when a product goes out of stock so they can command a higher price.
One last thing to note is this product’s elasticity. It’s clear that the rank doesn’t shift with the price. This means (to some extent) buyers aren’t purchasing based on price, but more likely on brand name. There is some price point this would change at (very few people would pay 89.99 for a $6 oven thermometer, for example) but the price on this product has never spiked long enough to determine this.
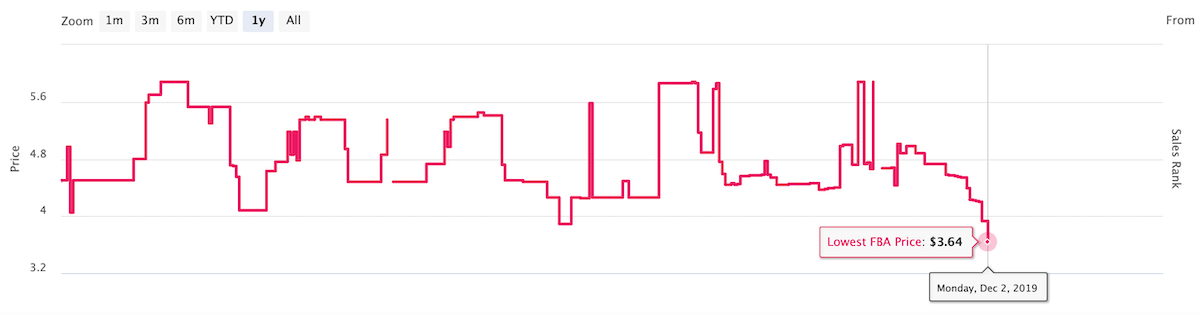
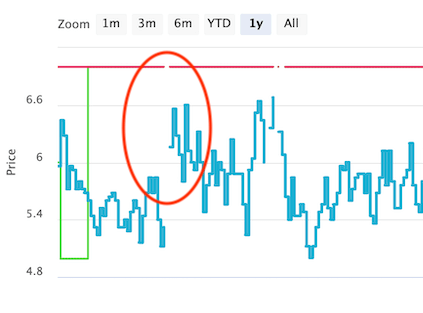
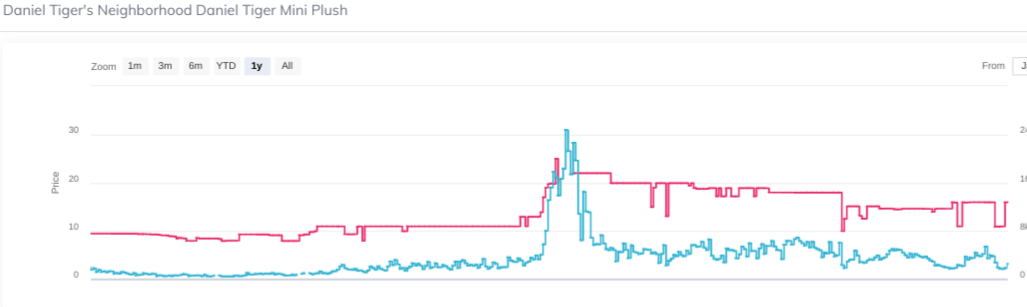
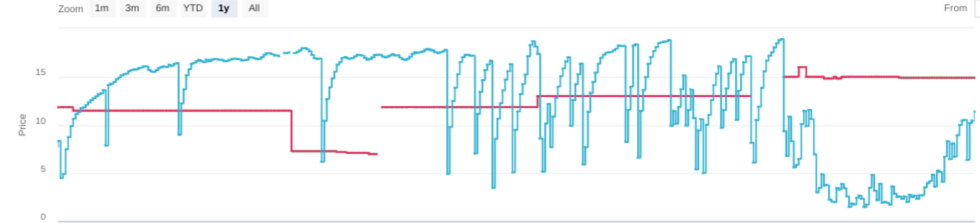
Some products have more elasticity than others. A good example of an elastic product is the kids’ plush toy shown below. Any price hike triggers a rise in best seller rank (and vice versa) in this toy.
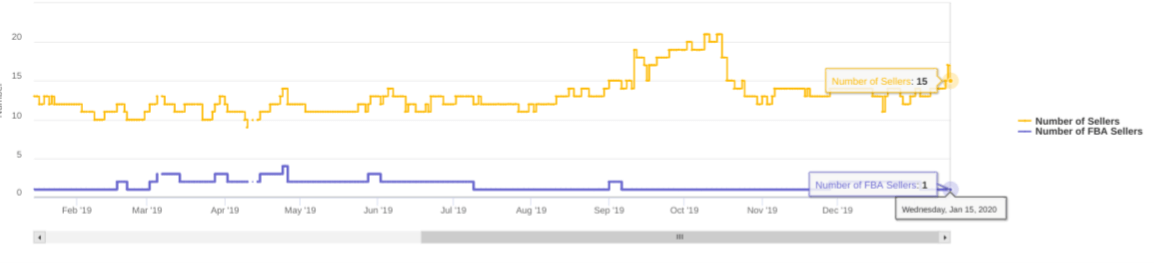
Now onto the last part of the graph. These lines each have data for how many sellers are on the listing in a given day (FBA and FBM). This product is dominated by one FBA seller, who happens to be Amazon itself.
What does a seasonal product rank look like?
Sometimes sellers will run into a product that seems like a gold mine, only to find out it only sells well part of the year. Most of the time this is obvious (most buyers aren’t purchasing chocolate Santas in July) but there are many products that aren’t as clear cut.
Seasonal products will have drastic dips in rank, sometimes accompanied by spikes in price. Here are a few examples:
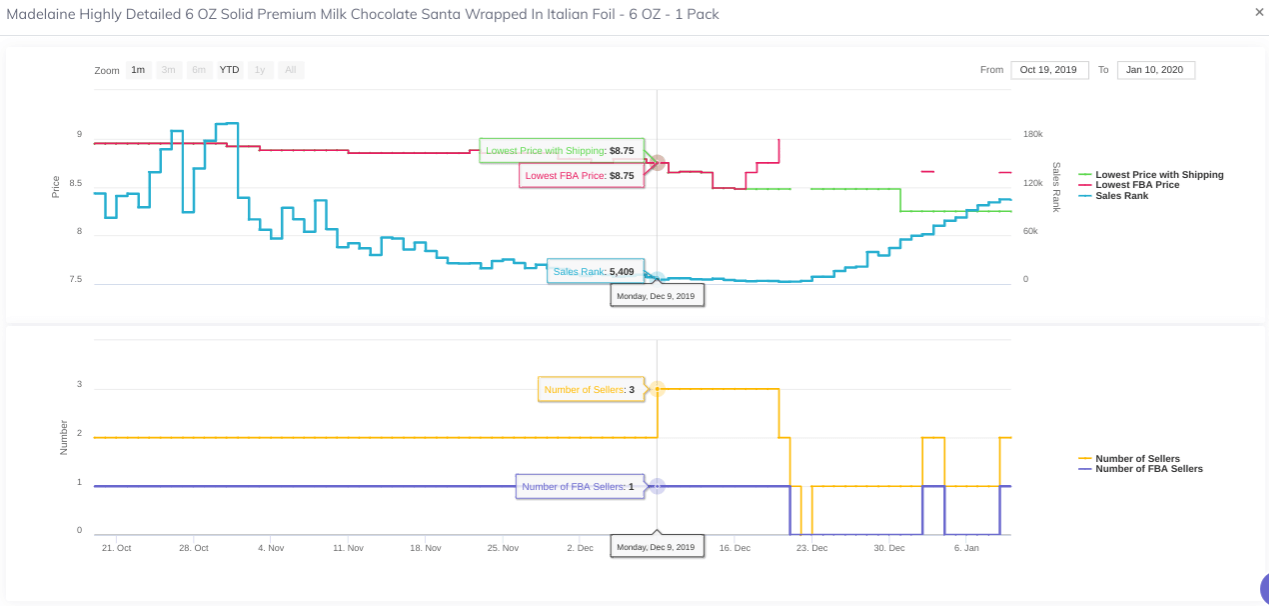
Chocolate Santas dip deeply in November and December. The price stays fairly stable.
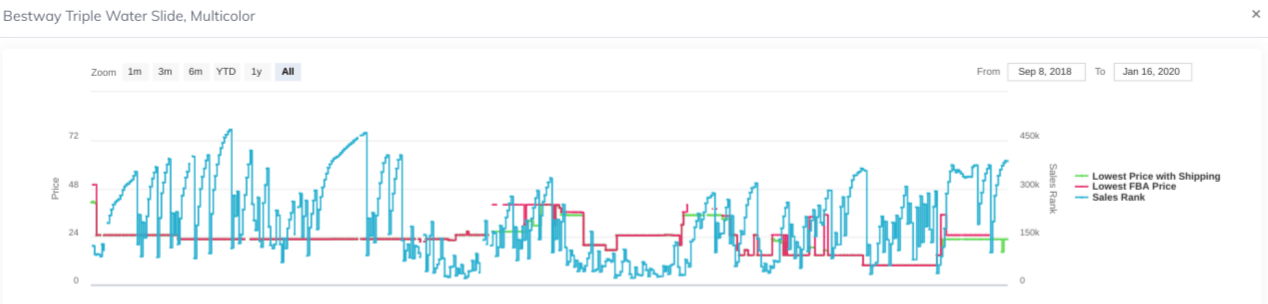
This waterslide sells year-round but only does a high volume in March and June. Note the dramatic price spikes and OOS areas.
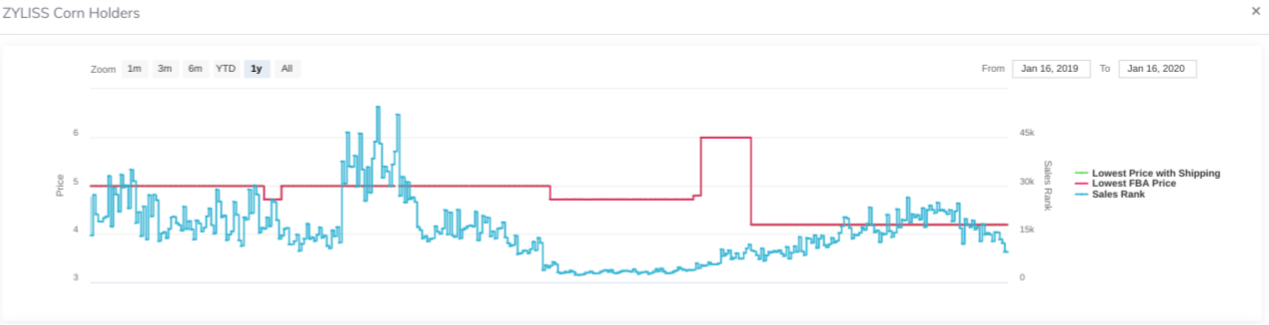
These corn holders follow the seasonality of corn itself. The price spikes once at the end of the season and then takes a dip, likely because this is a very inexpensive product that floods the market when suppliers want to get rid of it at the end of summer.
How can I figure out the volume of a product using a BSR chart?
If you’re trying to calculate the volume of a slow-moving product from a BSR chart, the process is fairly simple.
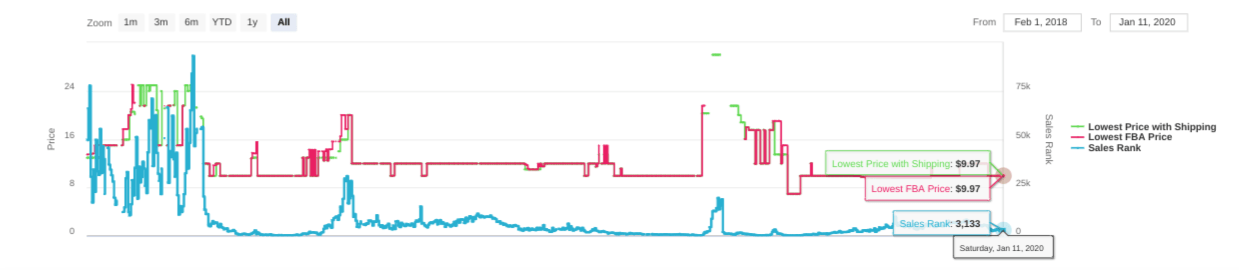
When an ASIN has a very high average rank (usually 100,000+) each major drop indicates a sale. On the graph below, you can clearly see around 30 sales (drops) over a 1 year time period. This isn’t an exact science since ProfitGuru only tracks one rank change a day, but it does give you a general idea of the sales potential.
Let’s break down the chart a little more.
Popular products present a different type of challenge. Every spike, dip, and fluctuation indicates an indefinite number of sales, since the rank is only tracked once per day. If you want to think about it broadly, most products with an average rank of 1000 sell more than 30 units a day (usually more, but it depends on the size of the category). You can expect a product with a BSR between 10,000-50,000 to sell 5-30 units a day. Anything above 50,000 can be calculated using the slow movers-method above.
This doesn’t help much if you’re looking for specific data, which is why we suggest plugging your ASIN into ProfitGuru’s Sales Estimator. It does all the math for you to figure out a specific number of units that sell daily.
This is a fast-moving item with a lot of daily fluctuation.
What are the easiest ways to improve my sales rank?
There’s no magic wand that will magically give you an uptick in sales or a magic edge above your competition, but here are a few things you can do to help your listings over the long run:
- Be Relevant: If you don’t have the right product, there’s no point in making an initial investment. Proof your product long before you order it: make sure similar products are already being sold successfully. Know in advance what kind of traction your keywords have. Choose products that already have a built-in audience.
- Convert: The better you convert, the lower Amazon algorithms will push down your rank. The average conversion rate on Amazon is 12% -- beat that and you’ll be in great shape. There are a lot of factors that go into making sure your customers finish the deal: great photos, competitive pricing, and beautiful packaging are just a few.
- PPC: It takes a lot of effort to rank for a handful of keywords organically, but with an optimized PPC campaign you can scale your sales by advertising on thousands of keyword searches. It’s not exactly effortless, but once you put the initial work into a campaign you’ll only have to tweak it once in a while.
Congrats for making it through the guide -- I know it’s a lot of info to swallow. Did I miss anything? Do you have more questions? Leave a comment below I’ll do my best to help you out.
